On September 6, 2024, officials from the Australian Department of Education tabled data on the proposed enrolment caps for individual public institutions that the government intends to impose as part of the ESOS Bill currently before parliament.
The caps – referred to as indicative student profiles (ISPs) – vary to a large degree across institutions and attracted much criticism for being “somewhat random” during the third day of senate hearings on the ESOS Bill last week (September 6).
Collectively, public universities will be able to enrol up to a maximum of 145,200 commencing onshore international students in 2025.
Despite the Bill’s “chaotic” implementation timeline, and the increasingly tight schedule for review, Australian Home Affairs has said that, if the legislation passes, the system changes would be ready for January 1, 2025.
The following graph shows the public institutions with the highest percentage decrease from 2023 international student numbers to proposed international student numbers under the 2025 cap allocations.
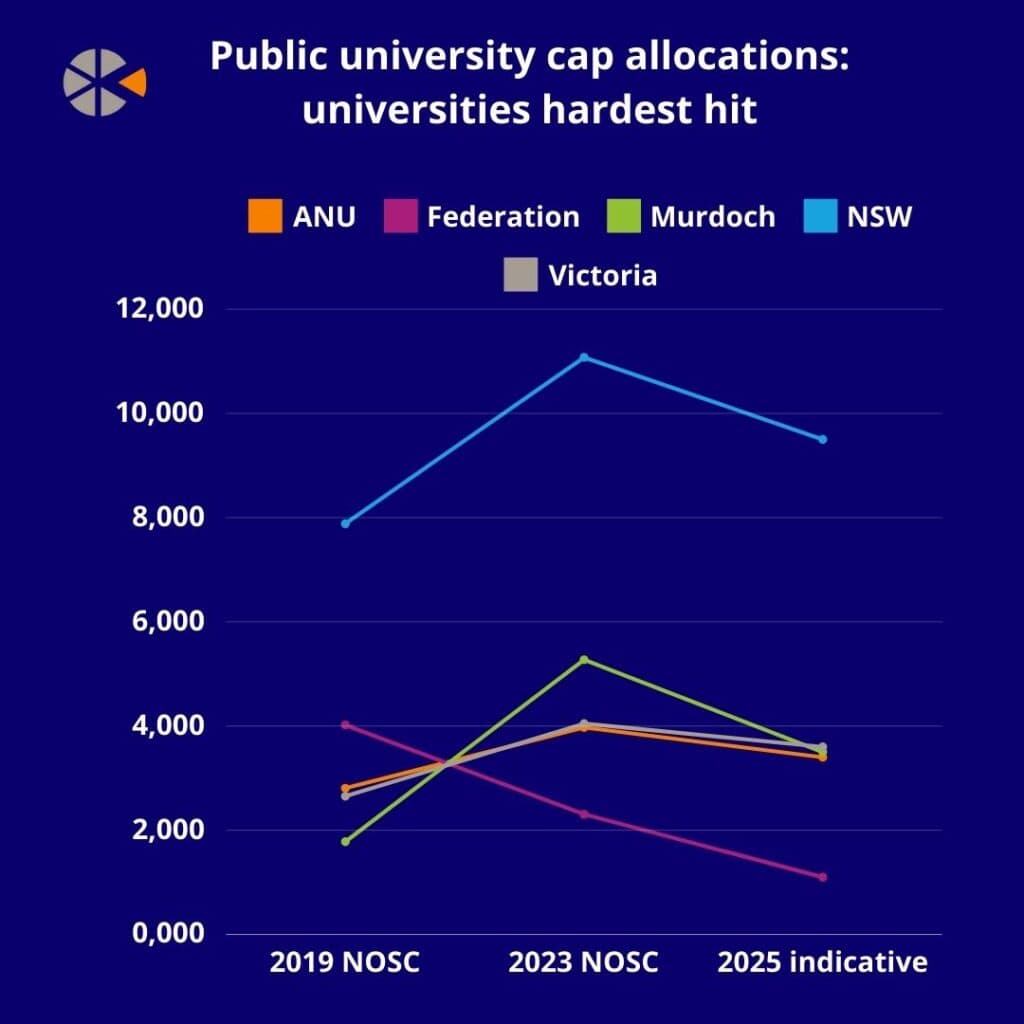
The figures represented in the graph – which can be found at the bottom of the article – refer to new overseas student commencements (NOSCs) in 2023 and 2019, before the pandemic.
Meanwhile, the 2025 figures represent ISPs for the upcoming year.
Federation University Australia, found in Victoria, has one of the highest proportions of onshore international enrolments at 35% in 2023, and has been hit the hardest by the proposed allocations for next year.
According to government data shared during the hearing, Federation will be allocated 1,100 international enrolments, representing a 52% decline from 2023 levels and 72% lower than pre-pandemic international student numbers.
Murdoch University in Perth, Western Australia, will bear a large brunt of the caps, with its proposed 2025 levels 34% lower than 2023 international student numbers.
The caps – referred to as indicative student profiles (ISPs) – vary to a large degree across institutions
Among the other public universities, Australia National University, University of New South Wales and Victoria University, are all looking at cuts of between 11-14% on 2023 figures.
As stipulated by the Department of Education, these figures are “indicative only”, with final numbers being published “as soon as possible, subject to the passage of legislation”.
All of the universities to be the hardest hit by the caps have international student populations higher than 30% of their overall student population.
The following list highlights the ten Australian universities with the highest proportion of international students, with those to be hardest hit by the caps highlighted in bold.
- University of Sydney (46%)
- University of Melbourne (41%)
- Australian National University (40%)
- Murdoch University (39%)
- University of New South Wales (39%)
- University of Queensland (39%)
- Federation University Australia (35%)
- Victoria University (33%)
- Monash University (33%)
- University of Adelaide (30%)
However, not all universities will see their international enrolments reduced if the Bill is passed.
The following graph displays the public institutions with the highest percentage increase from 2023 international student numbers and proposed cap allocations for 2025.

Charles Sturt University (CSU)’s proposed ISP for 2025 equates to a 517% rise on 2023 levels, but compared to 2019 enrolments, the cap represents a 67% decrease.
The University of Notre Dame Australia (UNDA), which in 2019 had an international student population of just under 300, will be allocated a cap of 700 students – equating to a 140% rise on 2023 levels.
The University of Sunshine Coast (USC) will see a 108% increase on 2023 enrolments, and Southern Cross University (SCU) and the University of Tasmania (UTAS) will be allowed to let in 38% and 26% more international students respectively.
Private Universities have been allocated 30,000 new international student placements next year, and VET providers face a cap of 95,000.
VET providers – whose individual numbers have not yet been made public – will face an overall cap of 95,000 international student commencements.
Indicative International student profiles for Australia’s publicly funded universities:
| Public University | 2019 NOSC | 2023 NOSC | Indicative 2025 ISP | % change 2023 to 2025 |
| Australian Catholic University | 1,273 | 1,580 | 1,700 | 8% |
| Australian national uni | 2,807 | 3,972 | 3,400 | -14% |
| Central Queensland University | 3,752 | 2,948 | 3,000 | 2% |
| Charles Darwin University | 523 | 1,997 | 2,200 | 10% |
| Charles Sturt University | 2,994 | 162 | 1,000 | 517% |
| Curtin University | 2,118 | 3,646 | 3,500 | -4% |
| Deakin University | 5,768 | 5,448 | 5,800 | 6% |
| Dedith Cowan University | 2,488 | 3,722 | 3,600 | -3% |
| Federation University Australia | 4,019 | 2,306 | 1,100 | -52% |
| Flinders University | 1,306 | 2,692 | 3,000 | 11% |
| Griffith University | 2,830 | 3,817 | 3,700 | -3% |
| James Cook university | 1,135 | 1,962 | 2,200 | 12% |
| La Trobe University | 3,660 | 4,095 | 4,100 | 0% |
| Macquarie University | 4,036 | 4,556 | 4,500 | -1% |
| Monash University | 9,998 | 8,310 | 10,000 | 20% |
| Murdoch University | 1,780 | 5,272 | 3,500 | -34% |
| Queensland University of Tech | 3,124 | 4,618 | 4,500 | -3% |
| Royal Melbourne Institute of tech | 6,599 | 6,409 | 6,600 | 3% |
| Southern Cross University | 2109 | 939 | 1,300 | 38% |
| Swinburne University of Tech | 2,397 | 4,681 | 4,500 | -4% |
| University of Adelaide | 3,314 | 3,155 | 3,800 | 20% |
| University of Melbourne | 8,600 | 10,000 | 9,300 | -7% |
| University of New South Wales | 7,883 | 11,075 | 9,500 | -14% |
| University of Newcastle | 1,271 | 1,565 | 1,600 | 2% |
| University of Notre Dame Australia | 26 | 292 | 700 | 140% |
| University of Queensland | 6,888 | 7,040 | 7,050 | 0% |
| University of Sydney | 11,027 | 12,790 | 11,900 | -7% |
| University of Western Australia | 1,536 | 2,742 | 3,000 | 9% |
| University of Canberra | 912 | 1,422 | 1,500 | 5% |
| University of New England | 354 | 681 | 700 | 3% |
| University of South Australia | 2,566 | 2,676 | 3,050 | 14% |
| University of Southern Queensland | 792 | 998 | 1,000 | 0% |
| University of Tasmania | 2,155 | 1,746 | 2,200 | 26% |
| University of Technology Sydney | 4,548 | 4,779 | 4,800 | 0% |
| University of Sunshine Coast | 1,188 | 578 | 1,200 | 108% |
| University of Wollongong | 2,980 | 4,042 | 3,700 | -8% |
| Victoria University | 2,652 | 4,046 | 3,600 | -11% |
| Western Sydney University | 2,640 | 3,461 | 3,400 | -2% |